Q2 2022
MindBridge Q2 2022 Release
With business professionals looking to comprehend vital risk segments within financial data, MindBridge is expanding its ingenuity to support professional judgment and serve the human need for financial transparency with new feature functionality and explainable AI.
MindBridge is continuing to expand its leading analytical depth helping you better understand business transactions and changes to operations.
Enabling Next-gen and Compliant Audit
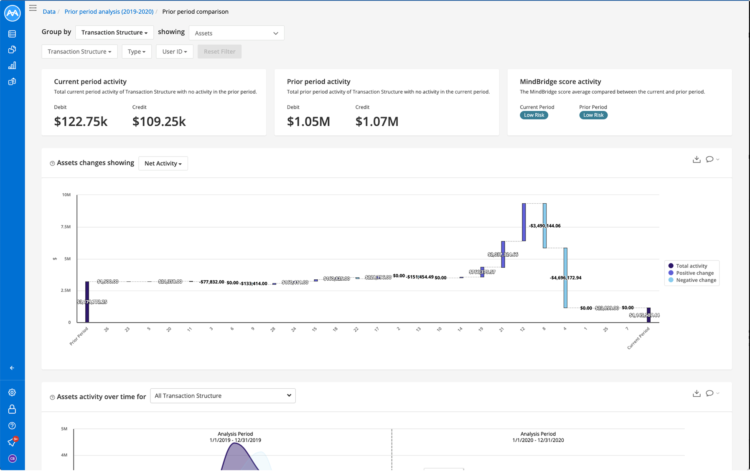
Prior Period Comparison Dashboard
We are thrilled to introduce a new dashboard to compare and assess changes in the current versus the prior period financial data so you can gain a deeper understanding of period-over-period changes.
How this will help you
MindBridge is continuing to expand its leading analytical depth helping you better understand business transactions and changes to the operations.
Only with MindBridge can you see the variances to the transaction structure and the prior period comparison.
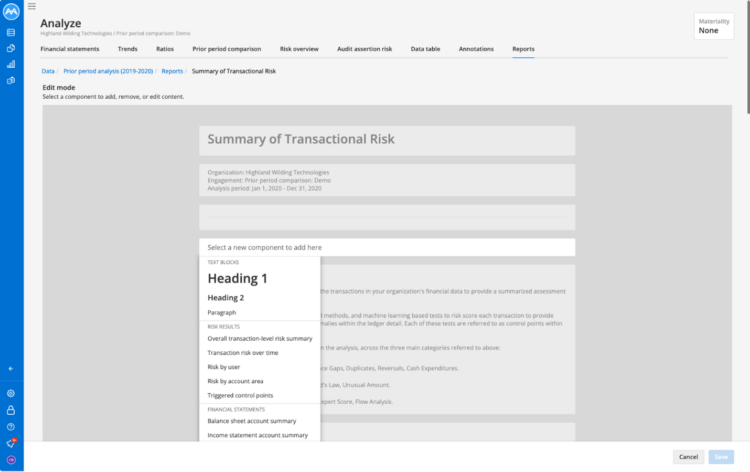
Value-add reporting and presentations
How this will help you
New control points
Control points are the algorithms that power MindBridge’s analytic capabilities. Empower your organization by using the newest version of MindBridge and gain access to the most advanced control points.
How this will help you
Data and Platform Scale
Data page
The changes we have made to the data page are designed to make the experience of loading multiple data files faster and easier for our users. This helps with minimizing the need for excessive scrolling through the page. We saw the need and are excited to now provide users with the ability to view and manage all their periods side by side as they progress through the data ingestion process.
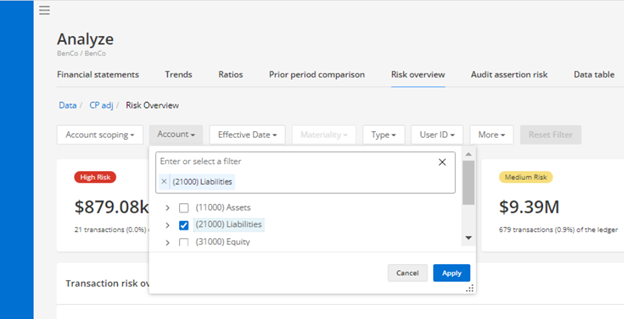
Persistent filters
Persistent filtering across MindBridge post analysis workflows help interpret results faster and easier saving time and an overall reduction in effort for our users. This assists in areas such as the data table where users are moving between the list view of transaction and transaction specific views.
What else do we have for you?
MindBridge is constantly evolving with state-of-the-art technology to expand its unique financial risk detection capabilities and to help support the professional judgment of our customers.
Visit our Knowledge Base to learn more about this and other releases.
Contact info@mindbridge.ai to talk to us today.
There's always so much more...
- Custom delimiters for data column start and end point
- Configurable risk scores (by account)
- Additional language support
- Performance and scalability for large files


