Our latest release of MindBridge Ai Auditor is another leap forward, with plenty of great features to help auditors throughout the audit process. Keep reading to find lots to love about this release.
Task creation and sample selection
Auditors can select samples, either manually or by using our Intelligent Sampler, to stratify the population of financial data by risk rating. Creating tasks in Ai Auditor allows your team members to work collaboratively to investigate anomalies in your client’s data.
In this release, you can create tasks and leverage the Intelligent Sampler on individual line entries. Prior to this release, you could only use the feature on transactions.
You can create filters and select samples manually by creating tasks on individual line entries which will be added to your audit plan. You can also leverage the Intelligent Sampler to stratify sample selection on entry view as described in the next section.
When you go to the Data Table tab, you can click on a transaction and see the individual line entries associated with a transaction, as shown in Figure 1.You can switch to the entries view by clicking on the Transactions button on the top right corner of the page, as illustrated in Figure 2.As seen above, you can launch Intelligent Sampler from the Entries View and you can create tasks on a line item by clicking on the button to add details to your task creation, including audit area for account balances or significant classes of transactions, as well as the related management assertion for the test being performed, as shown in Figure 3.You can also bulk select by checking the box on an individual line item and select the appropriate action item from the Actions drop-down as illustrated in Figure 4.Once you create a task on an entry, it will be added to your audit plan page.
Intelligent Sampler
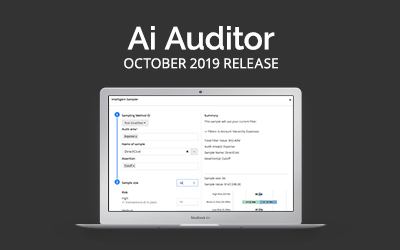
Auditors can select samples, by using Intelligent Sampler, to stratify the population of financial data by risk rating. In this release, we have improved the Intelligent sampler, as shown in Figure 5.
We have added a random sampling option to the sampling method to create a truly random sample from the population generated in the applied filter. Each item in the population has an equal chance of being selected.
The default sampling method is risk-rated that uses the entry or transaction risk score to stratify the population generated in the applied filter. This method is unique to Ai Auditor, and favors selecting the majority of the sample from the high and medium risk transactions.
You now have the ability to add Audit Area, Management Assertions, and sample name to the sample selection. You can also add multiple samples to the same population. In addition, we provide a visualization that shows the $ value of the selected samples for each risk bucket (high, medium, and low risk) and the total $ value of all the populations for the sample. This can be used to reconcile the total population for created filters to worksheets used for sample size calculation.
You can click on “Add to audit plan” to add the sample to the Audit Plan.
Audit plan
The audit plan is one of our many exports that provide sufficient and appropriate audit evidence to support the audit opinion. In particular, the audit plan provides a summary of items selected using Ai Auditor while preparing to perform a test of details.
On the Audit Plan page, we now provide more filters, allowing you to filter by audit area to understand the areas you have looked into and what management assertions you have selected samples for. The visualization at the top of the page has been updated to highlight the $ value for the selected filter.
All items added to the audit plan can be searched or filtered in various ways to provide a convenient overview of your sample selection.From the Audit Plan page, you can view the revised Audit Plan Export as a Microsoft Excel or CSV document as a source of audit evidence to be saved in your working paper solution. We have also improved the performance of the CSV export for large files.
You can export the entire plan into Excel or CSV format by clicking on the Export Entire Plan button or add filters to create a simplified list of items for your client to prepare for your inspection by clicking on “Export Filtered Plan”.
We have also enhanced the audit export details for this release. We now show a summary of the engagement, date, and analysis name, as well as filters that have been applied to the audit plan, if any, in the Summary tab, as shown in Figure 7.In the Data Tab, there are three buckets that illustrate information about the transaction and/or entries, tasks, and Control Points. We have added the entries to the audit plan, as well as the audit area and assertion names. Another improvement to the audit plan is that we now show the risk scoring of each Control Point for each entry in the audit plan.
Large transaction support
Transactions that contain a large number of entries can be present in financial data for a number of different reasons, for example, a daily point of sale summary where a number of ‘micro-transactions’ are recorded into a larger ‘daily’ transaction.
These types of transactions can limit an auditor’s ability to assess the true transaction risk or identify problematic entries. In Ai Auditor, large transactions are also often given higher risk scores due to the fact that a large number of entries contribute in a disproportionate way to the overall transaction risk score versus other transactions with smaller numbers of entries.
To this end, we now recognize and suggest alternatives for the treatment of large transactions. During the loading of data in the Review Data stage, as illustrated in Figure 9, Ai Auditor displays statistics about the file, including details about the number of transactions and their corresponding number of entries. Through the new design of the Review Data page, you can quickly understand that there are 27108 transactions in your file and 509 of them are very large transactions as illustrated in the transaction length summary visualization.
Ai Auditor now allows the user to apply an operation to the file, the Smart Splitter, to decompose each large transaction down to its matching entries, where each entry pair is identified by matching offsetting debits and credits. After running Smart Splitter there are no transactions with 501-1000 entries.For example:Each matching pair is then labelled as a new smaller transaction in the file where it can be risk scored along with other transactions in the file.
When selecting the Smart Splitter option, you have the ability to select the fields within the file to use as the primary transaction ID. This selection is then used to process the file and match containing entries, after which a preview is displayed to the user prior to committing to the operation on the entire file.
At the completion of the Smart Splitter operation, all transactions will run through the Smart Splitter, and the user continues with the analysis, where they will see new transactions appearing in the analysis with updated identifiers representing each entry within the transaction.
Create engagement
We improved the engagement creation page and added planning Date and Final Analysis Date. The Planning Date field is used to approximate the period available for interim work. This date is the earliest date for which you intend on having data from your client to use in planning. This field is optional but must occur before the final analysis date. Adding a planning date helps our Customer Success team prioritize and time your engagement.
The Final Analysis Date is the date that you intend on receiving the data from your client. This field is now a required field as it helps our Customer Success team plan any intervention work (if required). The Engagement Lead is the primary contact responsible for leading the audit. They will receive any and all proactive communications from our Customer Success team about ERP documentation, support, etc.
Enhancements to Libraries
In the May release of Ai Auditor, we introduced the Library feature to provide further flexibility to administrators to tailor the work done based on the industry that your client operates in.
Libraries contain all the business logic needed to perform analysis within a particular industry or market and allow you to customize an analysis based on industry types with different ratios, filters, and Control Points.
Through Libraries, you find the right information at the right time, and this is a big step forward in helping you complete your work faster and with greater transparency. Libraries give you a way to build standardized audit approaches. In the previous releases of the Library feature, you could customize ratios, and filters only.
In this release, we continue to extend the functionality of Libraries by allowing you to edit Control Point weightings within a Library that can be leveraged and reused across an Engagement. As shown in Figure 13, you can change the weighting of each Control Point through the scroll bar and you can save or discard changes.
Activity Report
In this release, the administrator can now track and collect user actions and behavior to get a complete timeline of all user activities to establish the events that have occurred and who caused them. The Activity Report, as shown in Figure 14, answers the ‘who, what, when, where, and how’ of all the user activities in Ai Auditor. With the Activity Report, administrators get precise information on critical events such as user logins, time of file load, time of analysis, and more.
The administrator can also go to Activity Tab and download the Activity Report. They can filter on date range and user, as well as select the event categories such as who created the engagement, organization, ingestion, and more.
Figure 15 illustrates an example of the Activity Report that shows the times when the user:
- Created the analysis
- Deleted the analysis
- Logged into Ai Auditor
- Deleted and created some tasks
- Created a Library called “Insurance”


