Improving audit risk assessments with AI-driven analysis of Accounts Receivable and Accounts Payable subledger data

Improving audit risk assessment longterm

The cornerstone of well-planned and high-quality audit engagements is a robust risk assessment process. Such a process is critical to identifying risks of material misstatement and their relative significance by providing a fulsome understanding of the entity subject to audit and the environment in which it operates.

The nature and extent of these audit risk assessment procedures will certainly differ from engagement to engagement, reflecting different types of operations, industries, and financial reporting complexities, however preliminary analytical review procedures are a common thread across all audits as a requisite component of the risk assessment process.

Traditional preliminary analytical review procedures

Practically speaking, preliminary analytical review procedures could include any combination of the following (not exhaustive):

  • Comparing actual financial performance to historical trends and balances
  • Reviewing actual financial performance (ratios, key financial metrics) against industry benchmarks
  • Reviewing actual financial performance compared to management forecasts and/or budgets
  • Performing inquiry of management to ascertain operational drivers for certain trends and patterns in the year-over-year results (i.e., “what’s changed?”)
  • Examining any material new contractual agreements executed in the period (leases, customer contracts, debt agreements, etc.)

Traditionally, these types of analytical review procedures take place at the level of how the financial statements aggregate the data by account or class of transactions, or perhaps at more granular levels of the chart of accounts. For example, you may compare how gross margin in the current period compares to historical periods or how increases in inventory year-over-year tracks with corresponding movement in the cost of sales accounts. In any case, it is ultimately the general ledger trial balance data and activity detail that underpins this type of review.

With a view towards a robust risk assessment process and obtaining a deep and operationally relevant understanding of your client’s business environment and financial performance, analysis and interrogation of the AR and AP subledger data as a complement to the traditional preliminary analytical review procedures at the financial statement level could be a source of highly valuable context to the results and empower you to conduct a more focused inquiry of your client’s management.

Accounts Receivable & Accounts Payable as critical inputs to audit risk assessment

Visualizing and interrogating subledger data can provide high-value insights and expose “root causes” behind some of the general ledger variances and patterns identified as part of your traditional preliminary analytical review procedures. This empowers you to better pinpoint an assessed risk and tailor your testing approach to most efficiently respond to that assessed risk.

Some examples of how to best leverage subledger information include:

Understanding how certain vendor and customer aged balances trend throughout the year

The aggregate total values of AR and AP at balance sheet dates might be relatively consistent year-over-year but there may be cause for further investigation and inquiry if, for example, the monthly ending balances demonstrate significant volatility throughout the year or seem out of pace with corresponding monthly sales or purchasing trends.

Understanding operational key performance indicators for customer and vendor “health”, and tracking those over the audit period

Tracking basic operational metrics like Days Outstanding and Turnover ratios, for specific vendors, customers, and in total, provides a lens of relative customer “quality” or vendor settlement patterns that may allow for risk to be identified more granularly. Comparing these ratios for a particular customer against the “aggregate” value allows you to identify specific customers or vendors that lag the overall average and therefore may indicate an existence or valuation risk around those balances or underlying contracts.

Expose the nature and volume of transactions on credit with related-party customers and vendors

Reviewing the subledger detail for transactions with all related entities is information that may not be readily available on the surface of the general ledger data and the relative dollar volume and activity of these transactions could be relevant to how risk is assessed around the accuracy, valuation, and presentation assertions.

Surface invoices or other records in the subledger (debit or credit memos, unapplied payments, etc.) that may be significantly aged

Isolating items in the subledgers that are significantly aged may tie directly to the risk around valuation and existence of these items specifically. Under a more nuanced lens, the existence of these types of stale records (or lack thereof) may be a relevant consideration to corroborating your understanding of the controls framework and how closely the subledgers are being reconciled and actively maintained.

Evaluate the volume and frequency of transactions at the level of a specific customer or vendor to corroborate inquiry of management and your understanding of the entity

Understanding basic data points around volume and frequency of transactions with a particular customer or vendor may help corroborate information learned from inquiry or your knowledge. For example, reviewing transactions with the entity’s landlord to confirm that 12 monthly equal rent payments were posted. Scanning this type of activity (either manually or with automated techniques) can surface invoices or payments for amounts that are potentially unusual for a certain customer or vendor and therefore perhaps may be indicative of risk.

Review for the volume and frequency of manual adjustments directly to the subledger detail

Manual adjustments or entries directly to the subledger, i.e., entries that don’t have a commercial document of record (invoice, cheque, credit memo, etc.) associated to them, may indicate fact patterns or internal processes that warrant further consideration from an audit perspective.

Perform basic statistical and rules-based tests and interrogate the subledger data to inform risk assessment

Certain procedures around data quality that are traditionally associated with journal entry testing, such as the following, may be very relevant to the subledger information. This includes any “hits” that would be relevant to deepen your understanding of your client’s accounting system and internal control framework and also advise the severity of assessed risk:

  • Reviewing descriptions for suspicious keywords
  • Duplicate document IDs
  • Two-digit Benford analysis
  • Other rules-based tests

How MindBridge automates and streamlines AR & AP subledger analysis

MindBridge AI has dedicated AR and AP modules that automatically analyze the subledger data and, without any scripting, provide high-value visualizations of the data and transaction-level analysis. These capabilities empower you to leverage subledger-level insights and anomalies as critical inputs to the audit risk assessment process.

Trends and patterns

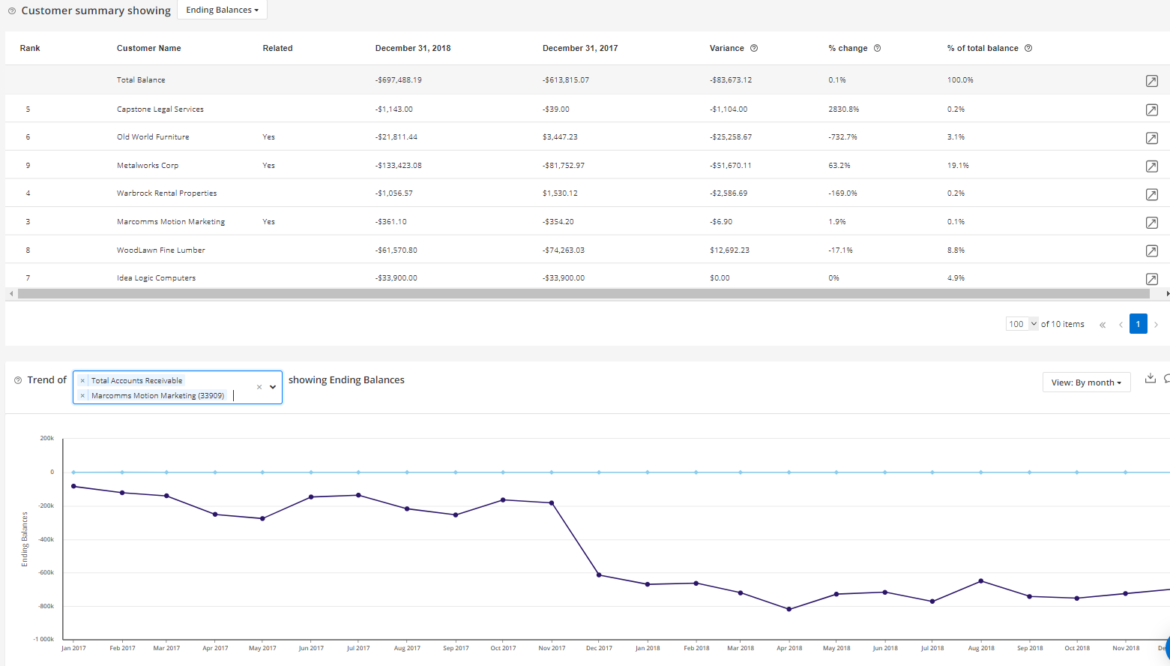
Ai Auditor provides the ability to visualize how monthly AR and AP balances or net monthly activity tracks over multiple years, at the customer and vendor level and also in aggregate. The visualization is customizable and provides the ability to compare certain customer or vendor trend lines against each other and identify patterns of deviation.

Vendors and customers who are related parties to the entity subject to audit are flagged directly in the summary detail to identify for specific review. 

internal audit tools

Key performance indicators

Days Outstanding and Turnover ratios are calculated at the customer and vendor level and visualized on a monthly basis, allowing you to identify where there are periods of potential distress or deteriorating quality. Similar to the ending balances and activity, you are also able to customize the visualization and compare certain customers or vendors against each other along the lines of these metrics to expose patterns of interest.

internal audit results

Ai Auditor also automatically identifies any new customers or vendors in the audit period, allowing you to identify the related volume of sales or purchasing growth specific to these entities.

Aging

Aging at the customer and vendor level is automatically calculated and captured across respective buckets of days outstanding (0-30 days, 31-60 days, etc.). For certain entries that are significantly aged or stale, you’re able to drill-in to all the transactions with a particular customer or vendor and ascertain which invoice(s) are contributing to those totals.

internal audit and governance

Data interrogation and risk

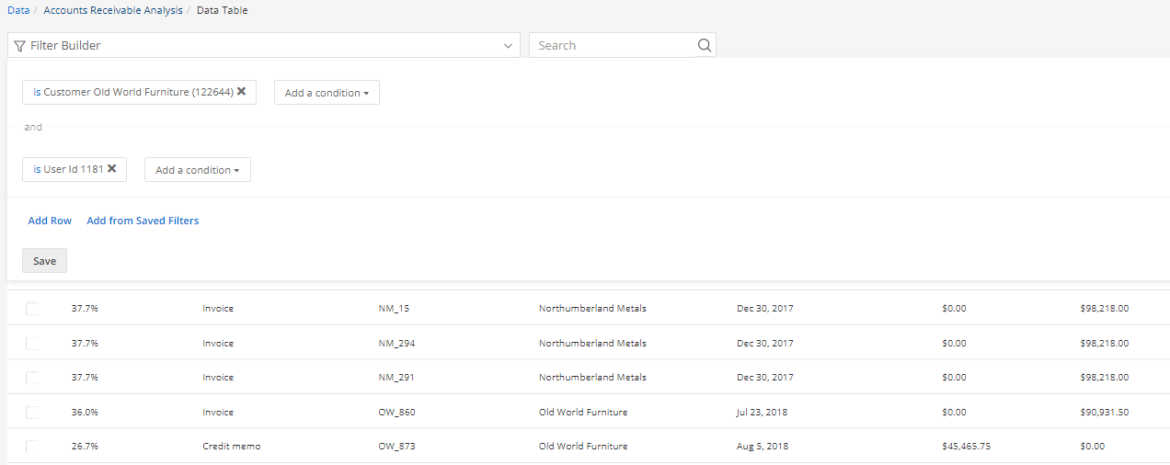
Navigating and querying the transactional level data via the Data Table in Ai Auditor provides a powerful and effective way to explore and validate the subledger activity. The Filter Builder functionality allows for multiple conditions to be placed on a query, using any element of the transactional record (date, amount, user, entry type, etc.). This allows you to build and save functions that allow you to get a sense of the type, frequency, and volume of transactions with certain vendors or customers.

reasonable assurance audit

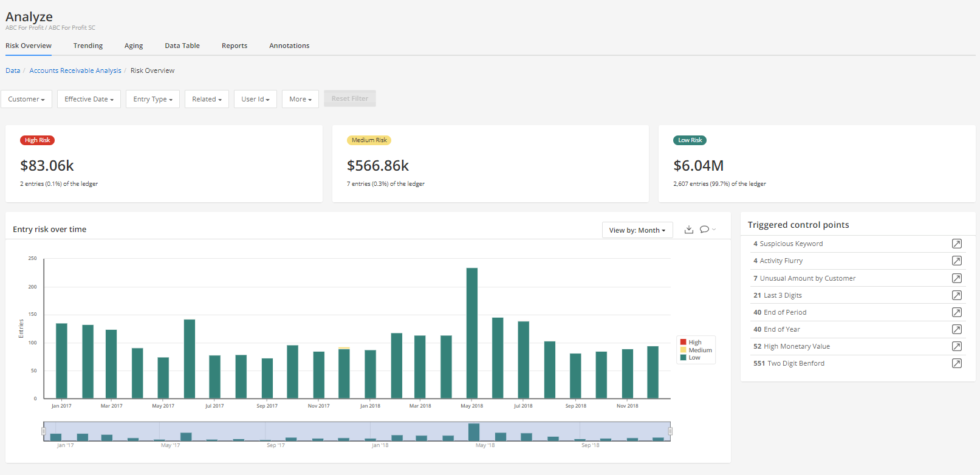
Control Points, which are various statistical, rules-based, and machine learning tests, are run against every transaction and the results are summarized on a dashboard that supports interactions like filtering and drill-through.

corporate internal auditor

Combining the query building capabilities of the Data Table with the feature of every transaction being scored against the various Control Point tests, you are empowered to identify relevant populations for sampling and have selections automatically identified on a risk-stratified basis. Approaching the sampling process through the lens of transactional risk ensures that you’re focusing your audit procedures around the entries which appear anomalous.

Take the first step towards unlocking critical subledger-level insights for risk assessment

To learn more about Ai Auditor and subledger analyses, contact sales@mindbridge.ai.

AI in finance: Helping professionals shift from hindsight to insight to foresight

Stopping dominoes with foresight

We are facing an unprecedented time of global uncertainty created by the COVID-19 virus that has unleashed a global healthcare crisis. Humanity is fighting a war against an invisible enemy that is attacking humans around the world and sparing no country. We need not be pessimistic or optimistic but rather realists and learn from the history of humanity. Human ingenuity will prevail, and humanity will survive.

We have entered a new world after COVID-19 with very different assumptions than we had in the old world when the world GDP yielded a record high of $85T. The world GDP has been severely impacted by the lockdown stipulations that were imposed to minimize the spread of the virus within the population. The key pillars of the economy are consumer and companies’ spending. If this slows down, it can lead to a recession and even depression. The lockdown restrictions are being relaxed and governments and central banks around the world are injecting massive amounts of funds into the hands of individuals and companies in an effort to reopen the economy to avoid an economic crisis.

How can artificial intelligence in finance help organizations pull through?

A renewed focus on financial errors

During economic uncertainty, an added vigilance is needed by those responsible to ensure the accuracy and integrity of the financial records that are being relied upon to make decisions about the operations of their organizations. A report by the Association of Certified Fraud Examiners (ACFE) “2020-Report to the Nations”- 2020 Global Study on Occupational Fraud and Abuse estimates that the yearly cost to the world due to fraud and abuse is about $4.5T or 5% of the world GDP. They examined over 2500 cases from 125 countries with combined losses of $3.6B with an average loss by case of $1.5M and a typical case lasting 14 months before being detected.

Whereas corruption was the most common type of fraud, the most costly were financial statements fraud schemes, even though they represented only 10% of the cases.  The breakdown of the detection methods reveals that analytics plays only a small role in the detection of occupational fraud: Human tips; 43%, internal audit; 12%, management reviews; 5%, by accident; 5%, whereas external audit catches only 4%.

A 2019 survey by Blackline provided insights into the concerns by executives with inaccuracies in financial data. With over 1100 C-suite executives and finance professionals from mid- to large-size organizations around the world, the white paper stated that:

“55% are not confident that they can identify financial errors before reporting results, 70% claim that their organizations made a significant business decision based on inaccurate financial data and 26% are concerned over errors that they know must exist but they have no visibility”.


The power of AI in finance

Finance professionals that rely on outdated tools and methodologies do not offer the best visibility into finding errors, errors with intent, errors that are considered fraud, and general mismanagement of the financial dataset in their organizations. The world is already witnessing a major trend toward moving to the cloud and becoming digital native and these must be vigorously pursued by organizations that want to be of the forefront of growth post the crisis.

Becoming digital native enables companies to move towards a near real-time view of their financial data and, coupled with AI in finance functions, the ability to fully analyze 100% of transactions. This ensures transparency to key stakeholders such as board members and auditors and aids in the identification of any anomalies in their financial records.

Currently, a company’s financial records are examined by external auditors on a yearly basis and evaluated using a sampling method that leaves the bulk of the dataset untouched. This method of rear view-mirror assessment provides C-suite executives with a hindsight perspective and the fear that decisions are made based on inaccurate and untimely information. Using AI-based tools to review 100% of the financial records in near real-time offers C-level executives with insights into data and, by using the appropriate analytics built into the AI applications, offers foresights into the operations of the company.

The two most important behaviors that companies must have to thrive post COVID-19 are resilience and adaptability. Resilience is defined as the ability to withstand or recover quickly from difficult conditions whereas adaptability is defined as the quality of being able to adjust to new conditions. Companies must build their operations and culture around resilience and adaptability so they can work efficiently during the “new normal” when we emerge out of this dark tunnel will become stronger and better off.

An article published by the Boston Consulting Group titled “The Rise of the AI-Powered Company in the Postcrisis World” highlights the tremendous opportunity for companies that are going to digital native, moving to the cloud, and adopting AI in finance applications to supercharge their operations. Arvind Krishna, in his inaugural speech as IBM’s new CEO, said, “I am predicting today that every company will become an AI company – not because they can, but because they must. Digital transformation means putting artificial intelligence at the center of workflows, and using the insights generated from that process to constantly improve products and services.”


How auditors use AI-driven financial ratios to understand risk

information about auditor

In times of great uncertainty, we all look for a crystal ball.

Also known as an orbuculum or crystal sphere, legend has it that a crystal ball is a fortune-telling object. But the use of crystal balls to predict the future is pseudoscience and there’s no evidence that they can validly predict the future.

Time and again, businesses and their advisors have proven that monitoring key performance indicators and ratios can be helpful to understand current business health and, some might say, predict future events. With the advent of artificial intelligence and machine learning, we now have the ability to augment this work with large amounts of data and perform complex calculations using an unprecedented number of variables to increase its accuracy.

MindBridge Ai Auditor gives this power to auditors, helping to evaluate financial health, discover trends in risk, and enabling better decision making.

Here’s a quick rundown on some ratios within Ai Auditor and how they can help.


Current ratio

The current ratio is a liquidity ratio used to evaluate a company’s ability to meet its short-term debt obligations by measuring the adequacy of the company’s current resources to cover its debt. To calculate, you divide current assets by current liabilities.

Companies in crisis will likely see their current ratio decrease as they draw down lines of credit to stockpile cash and use cash to maintain operations while revenue and accounts receivable decline. An example is Boeing drawing down its full $13.8B line of credit to stockpile cash to maintain operations and deal with the damage the airline industry is experiencing.

A healthy company has a current ratio of more than 2, whereas a company who is in trouble has a current ratio of less than 1.


Operating cash flow to sales ratio

Even with a healthy current ratio, cash and cash flow must be monitored because of uncertainty on accounts receivable and cash is key to the success and survival of any business. The operating cash flow to sales ratio indicates a company’s ability to generate cash from its sales.

Ideally, as sales increase, operating cash flow should increase by the same. However, in a time of crisis, accounts receivable may take unusually longer to collect as the market manages cash more carefully and takes longer to pay. An example of this ratio decreasing is the difficulty that oil producers across the world are facing as demand for oil plummets, supply increases, and oil companies have a more difficult time generating cash from their sales.

Though it is normal to see change in a period of change, the higher the ratio the better, and it should find a level of consistency over time.


Debt to equity ratio

The debt to equity ratio is an indicator of a company’s financial health. This ratio is indicative of the company’s ability to meet financing obligations as well as its financing structure.

It will be normal in a crisis to see this ratio increase as companies borrow heavily against their lines of credit and other debt. Investors will also be hesitant to provide more equity in a crisis especially as the markets are in decline. Further, raising money via equity offerings at a time of depressed markets is expensive to businesses. This causes companies to rely on debt and since increasing debt brings an increasing ratio, lenders will eventually consider it unhealthy.

This is part of the reason that the Small Business Administration announced additional small business support of up to $2M loans to small businesses who qualify during the coronavirus (COVID-19) epidemic.

A ratio of about 1 is optimal where a ratio higher than 2 is considered to be unhealthy.


Cash flow to debt ratio

Cash flow is king to any business as no business can operate without an ability to pay their bills. The cash flow to debt ratio is often considered the best predictor of financial business failure. This ratio is calculated by dividing cash flow from operations by total debt. A higher ratio indicates a company is more able to cover its debt.

Often free cash flow is used rather than operating cash flow because this takes into account capital expenditures. With COVID-19 essentially grounding international air travel, airlines are seeing a huge decrease in cash flow to debt ratio, so much so that the airlines are seeking a $50B aid package from the US government.

A ratio higher than 1 is healthy but any value below 1 is indicative of an impending bankruptcy within a few years unless the company takes steps to improve its situation.

Another metric often used to predict potential bankruptcy is the Z-score, which is a combination of several financial ratios used to produce a single composite score.


What do these ratios have in common?

Other than the fact that they are in no way associated with crystal balls, they are very important to a business of any size in a time like this and they can be augmented and presented using MindBridge Ai Auditor.

As businesses create plans and seek advice from their advisors, Ai Auditor can present intuitive dashboards of ratios such as these (and more) by using a 100% complete set of general ledger data. In addition, by leveraging machine learning and AI, Ai Auditor can provide analytics of these ratios to evaluate deviations from expected ranges across 12 months of data. Additional analysis is also possible on more detailed ledger data such as accounts payable and accounts receivable ledgers.


So what’s with the crystal balls?

Whereas we have all been led to believe that the future-telling effect of crystal balls is pseudoscience—which very well may be true—there do exist approaches and high-tech tools that enable the use of massive data sets to help gain incremental clarity about the future.

Ai Auditor isn’t pseudoscience, it’s right here, right now.

The auditor’s fallacy: The law of small numbers

big data analytics in auditing

Humans have used simple statistical sampling for millennia to make generalized sense of the world around us. Living in a resource-constrained world, statisticians gave emperors, surveyors, and accountants a simple workaround to the prohibitively intensive process of counting, checking, and validating everything. Sampling is the selection of a subset (a statistical sample) of individuals from within a statistical population to estimate characteristics of a much larger population.

Random sampling is an old idea, mentioned several times in the Bible with the word “census,” derived from the Latin word censere – “to estimate”. One of the world’s earliest preserved censuses was held in China in 2 AD during the Han Dynasty and appeared later in Ancient Egypt and Greece as a means of tallying or estimating population characteristics and demographics. Historically, the immense benefits of sampling’s simplicity outweighed any cost to accuracy. “Close enough” was good enough.

Fast forward to 2019 and we’re living in a tremendously different world with exploding data volumes and complexity. One domain where this is particularly problematic is the world of audit and assurance, where achieving a passable level of reasonable assurance is increasingly challenging.

For MindBridge Ai, the most obvious place to apply our advanced analytics and breakthroughs in machine learning is the audit world. To help everyone move toward a more wholesome and comprehensive risk analysis, enabling more informed decisions.

Simply, MindBridge Ai Auditor can be thought of as an advanced transaction analysis platform and decision-making tool that amplifies our ability to make sense of the complex and data-saturated world around us. Within our digital world, it’s now possible to pivot from reliance on sampling to algorithmically analyzing everything in a population.

Why is this evolution a good idea?

Why audit sampling doesn’t work

In Daniel Kahneman’s seminal work, “Thinking, Fast and Slow”, the author deals with problems related to “the law of small numbers,” the set of assumptions underlying prevailing statistical sampling techniques.

People have erroneous intuitions about the laws of chance. In particular, they regard a sample randomly drawn from a population as highly representative, that is, similar to the population in all essential characteristics. The prevalence of this belief and its unfortunate consequences for the audit and assurance business are the countless high-profile audit failures. The mounting issues related to outdated standards and problems related to transparency and independence have prompted regulators to go as far as tabling legislation for the break-up of the dominant Big Four firms.

Kahneman makes the point that we’ve known for a long time: The results of large samples deserve more trust than smaller samples. Even people with limited statistical knowledge are intuitively familiar with this law of large numbers but due to human bias, judgmental heuristics and various cognitive filters, we jump to problematic conclusions/interpretations:

  • Humans are not good intuitive statisticians. For an audit professional, sampling variation is not a curiosity, but rather it’s a nuisance and a costly obstacle that turns the undertaking of every audit engagement into a risky gamble.
  • There’s a strong natural bias towards believing that small samples closely resemble the population from which they are drawn. As humans, we are prone to exaggerate the consistency and coherence of what we see. The exaggerated faith of auditors in what can be learned from a few observations is closely related to the halo effect. The sense we often get is that we understand a problem or person or situation when we actually know very little.

This is relevant for auditors because our predisposition for causal thinking exposes us to serious mistakes in evaluating the randomness of a truly random event. This human instinct and associative cognitive machinery seeks simple cause and effect relationships. The widespread misunderstanding of randomness sometimes has significant consequences.

The difficulty we have with statistical irregularities is that they call for a different approach. Instead of focusing on how the event came to be, the statistical view relates to what could have happened instead. Nothing, in particular, caused it to be what it is – chance selected from among its alternatives.

An example shared by Kahneman illustrates the ease with which people see patterns where none exist. During the intensive rocket bombing of London in World War II, it was generally believed that the bombing could not be random because a map of hits revealed conspicuous gaps. Some suspected that German spies were located in the unharmed areas. Careful statistical analysis revealed that the distribution of hits was typical of a random process and typical as well in evoking a strong impression that it was not random. “To the untrained eye,” the author remarks, “randomness appears as regularity or tendency to cluster.” The human psyche is rife with bias and errors in calculation, that have meaningful consequences in our work and lives. Algorithmic and computational tools like MindBridge Ai Auditor stand to improve the human ability to make better and less biased decisions.

Minimizing risk exposure

In Kahneman’s article “Belief in the Law of Small Numbers,” it was explained that intuitions about random sampling appeared to satisfy the law of small numbers, which asserts that the law of large numbers applies to small numbers as well. It also included a strongly-worded recommendation “that professionals regard their statistical intuitions with proper suspicion and replace impression formation by computation wherever possible”. As an example, Kahneman points out that professionals commonly choose samples so small that they expose themselves to a 50% risk of failing to confirm their true hypothesis. A coin toss.

A plausible explanation is that decisions about sample size reflect prevalent intuitive misconceptions of the extent of sampling variation. Technology such as machine learning and pattern recognition are removing this bias to the enormous benefit of practitioners currently at the mercy of mere sampling luck to find what is important.

Thanks to recent advances in cognitive psychology, we can now see that the law of small numbers is part of two larger stories about the workings of the human mind:

  • Exaggerated faith in small numbers is only one example of a more general illusion – we pay more attention to the content of messages than to information about their reliability. As a result, we end up with a view of the world around us that is simpler and more coherent than the data justifies. Jumping to conclusions is a safer sport in the world of our imaginations than it is in reality.
  • Statistics produce many observations that appear to beg for a causal explanation but do not lend themselves to such an explanation. Many facts of the world are due to chance including accidents of sampling. Causal explanations of chance events are inevitably wrong.

We are at an important crossroads where we must reconsider traditional approaches like audit sampling in the context of the incredible technology that is now available. For companies that are struggling to interact with huge volumes of digital transactions, detect risk, and extract meaningful insights, MindBridge Ai Auditor is an elegant and powerful solution.