Unlock payroll precision driven by AI
Examine hourly rates, hours worked, unusual payment patterns, and more to reduce time and effort required for manual reviews.
MindBridge AI™ for payroll data
Increase visibility and build risk resiliency
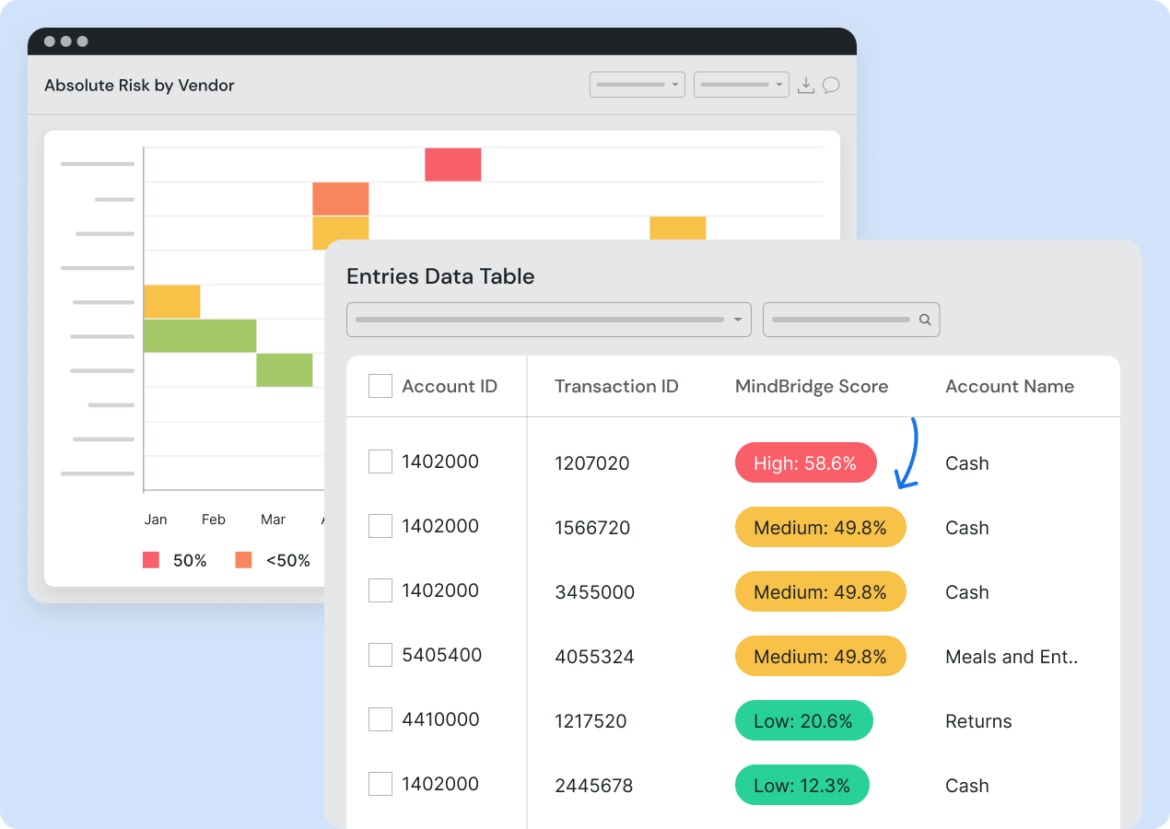
Data exploration
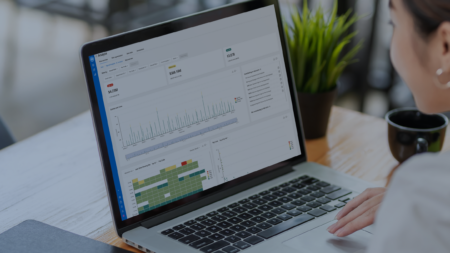
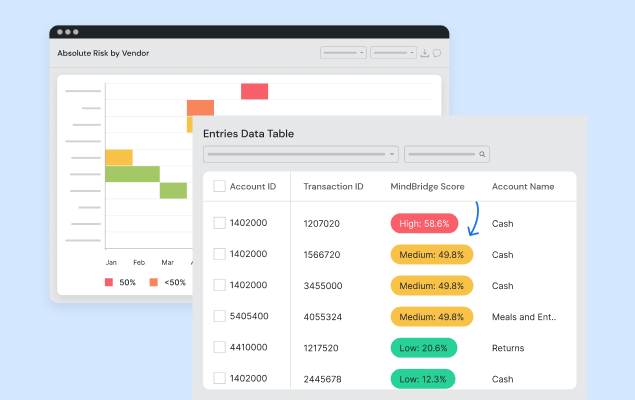
No scripting or formulas are required, making data exploration easy and user-friendly. Filtering capabilities allow for the handling of more complex tests, supporting nuanced financial analysis.
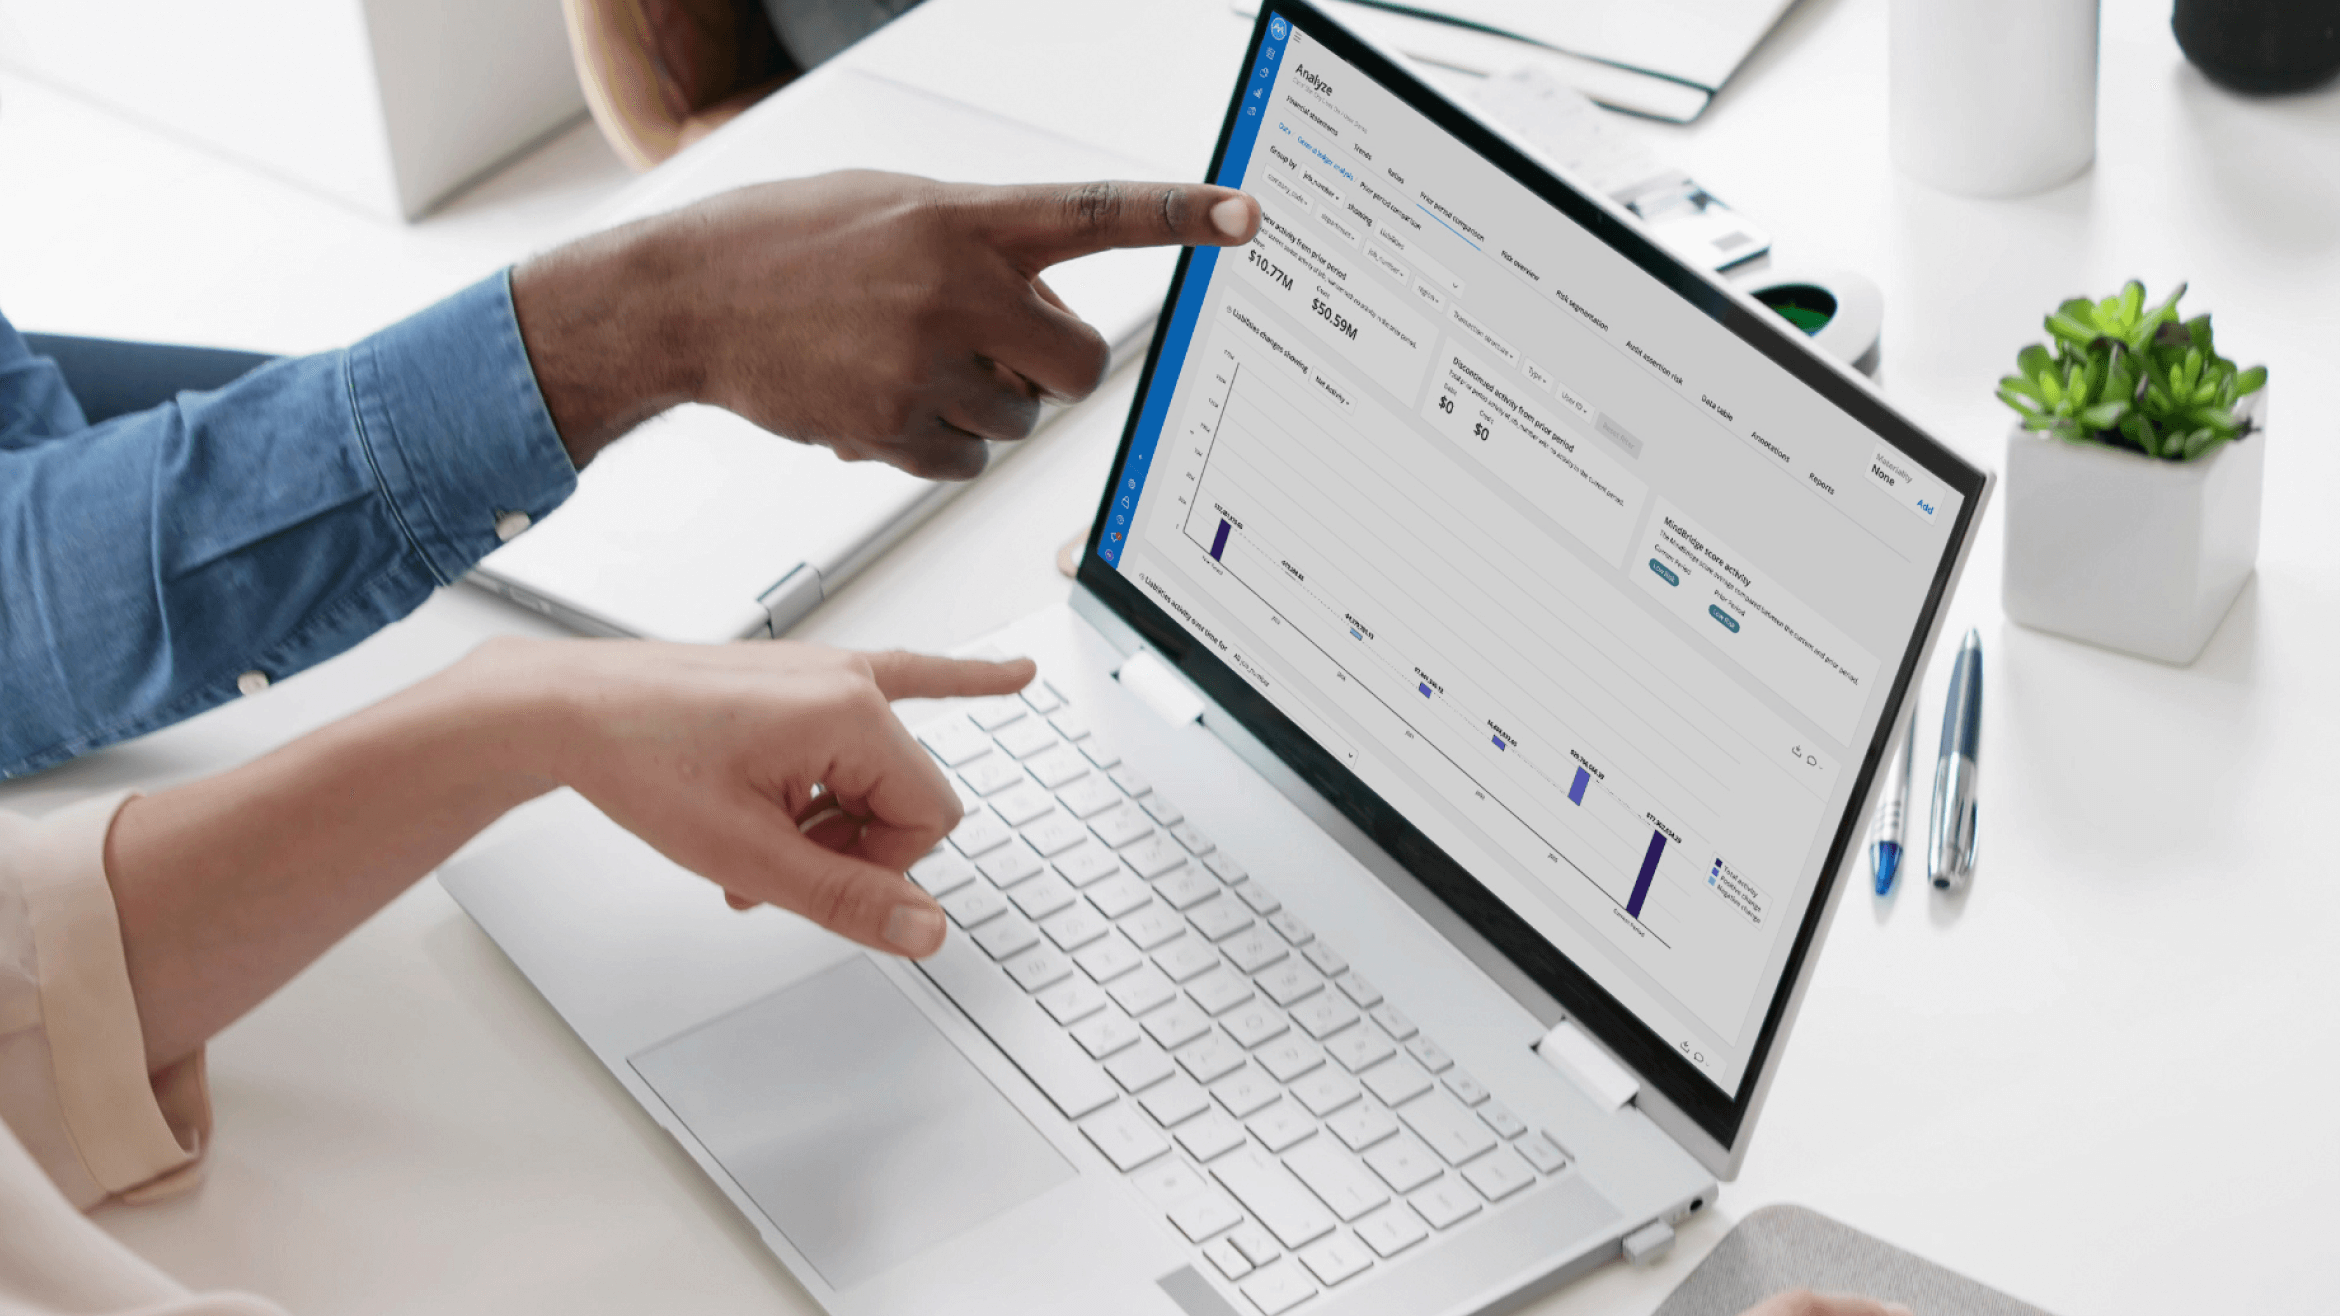
Prior period comparisons
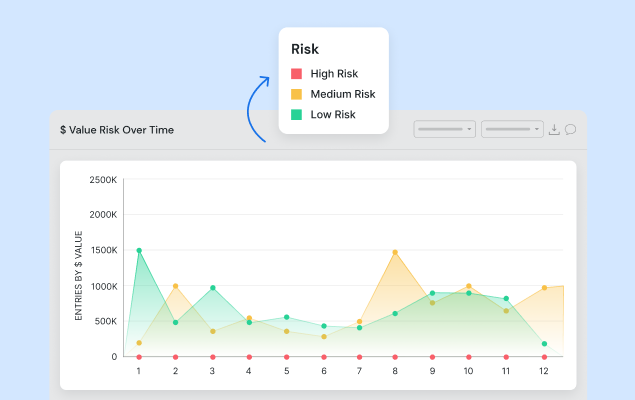
Changes over periods are flagged based on analyzing transactional structures, risk levels, volume, and monetary value.
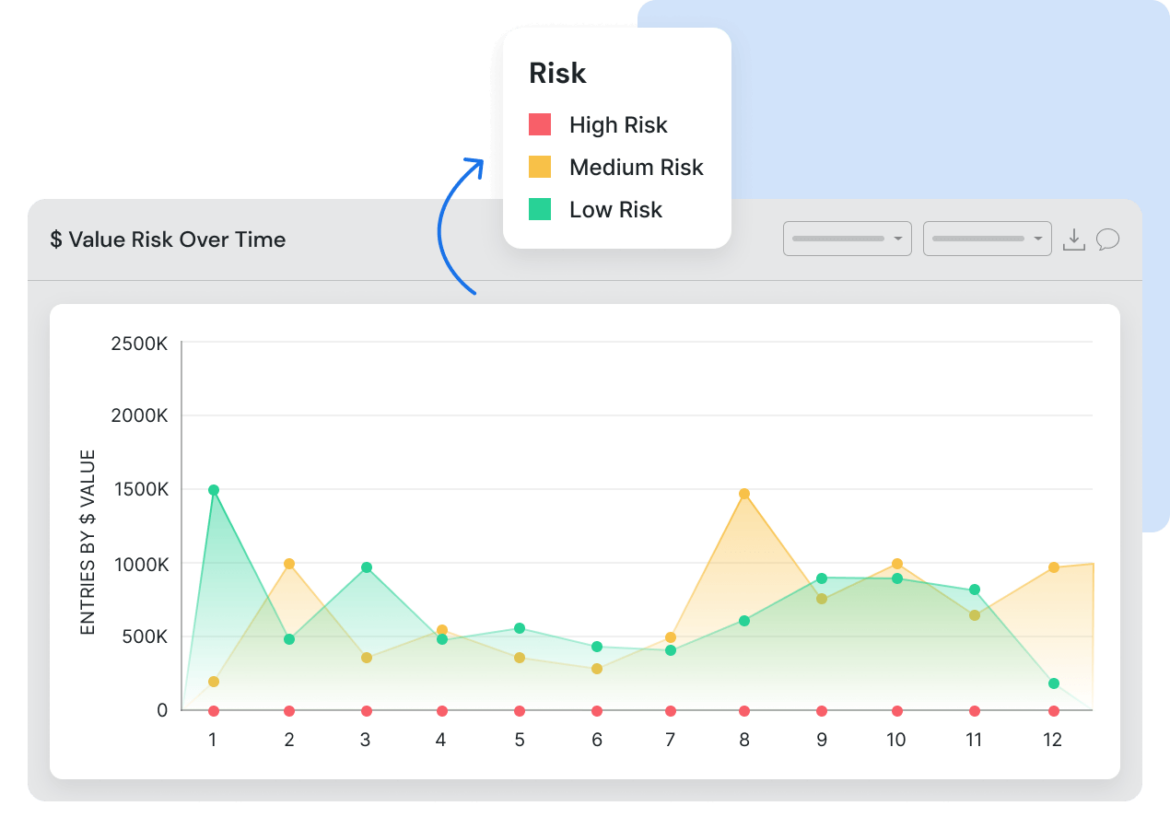
Trend analysis
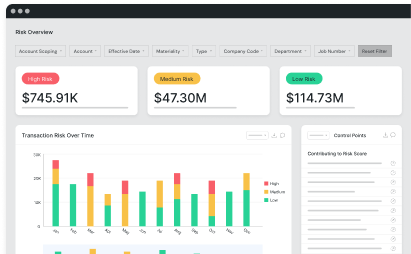
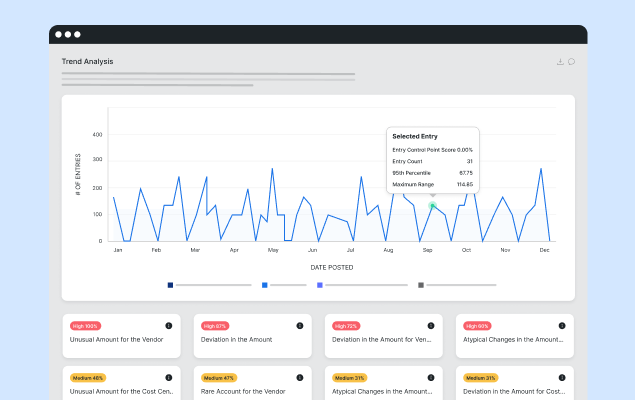
Trending visualizations enable period-over-period analysis based on activity, with the capability to dynamically filter using various fields.
Documented results
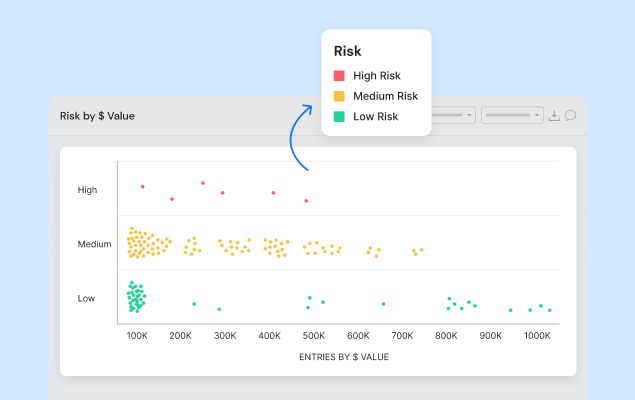
Auto-generated reports based on dashboards and data exploration provide streamlined documentation for reporting.
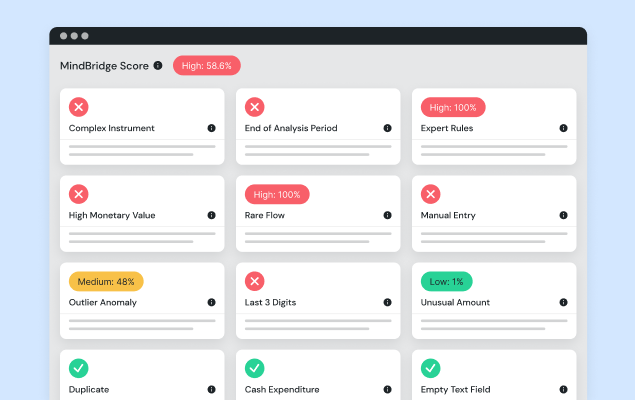
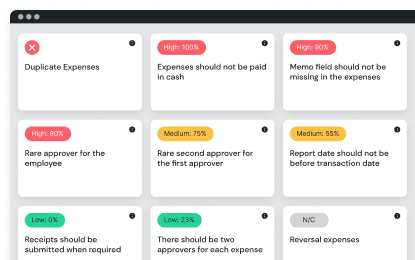
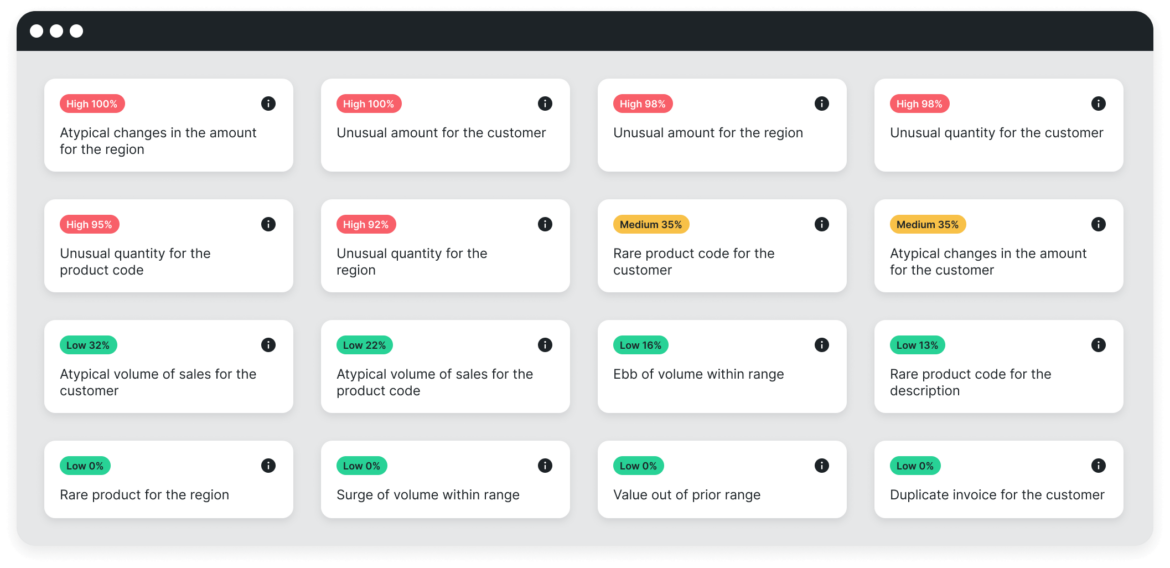
Anomaly detection
Identifying irregularities and insconsistencies which may indicate potential fraud or errors, ensuring the accuracy and integrity of financial data.
Why audit and finance leaders utilize MindBridge payroll risk analytics

Anomaly detection
Identifying irregularities and insconsistencies which may indicate potential fraud or errors, ensuring the accuracy and integrity of financial data.
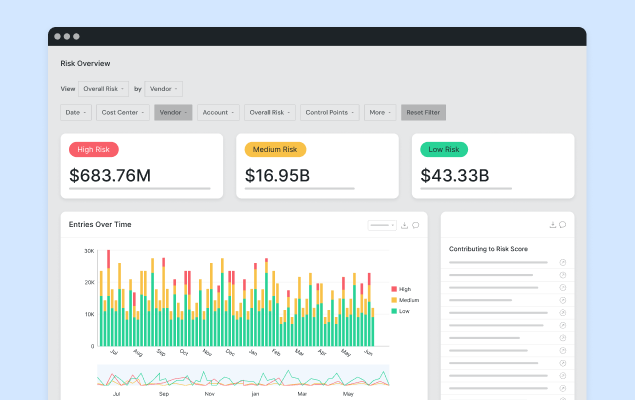
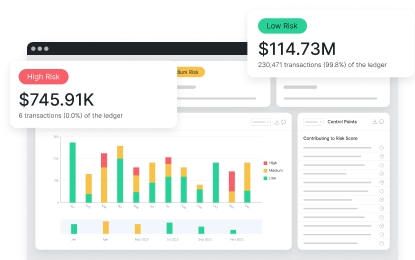
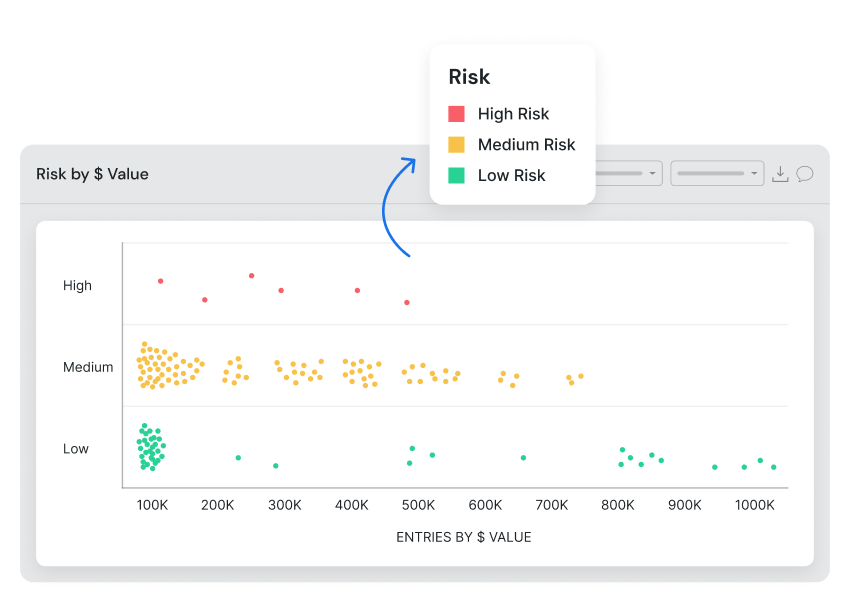
Risk scoring
100% of transactions are scored and organized based on the underlying advanced data analytics.

Data exploration
No scripting or formulas are required, making data exploration easy and user-friendly. Filtering capabilities allow for the handling of more complex tests, supporting nuanced financial analysis.
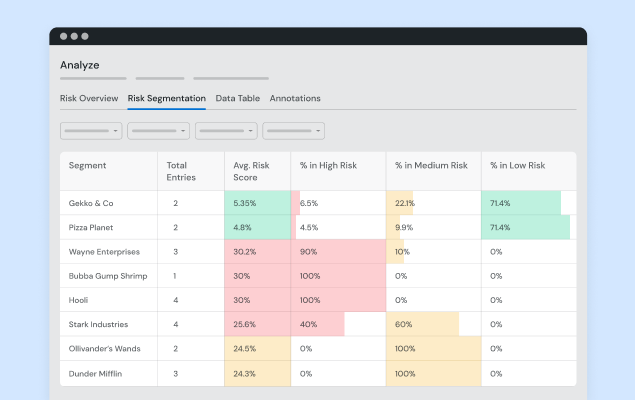
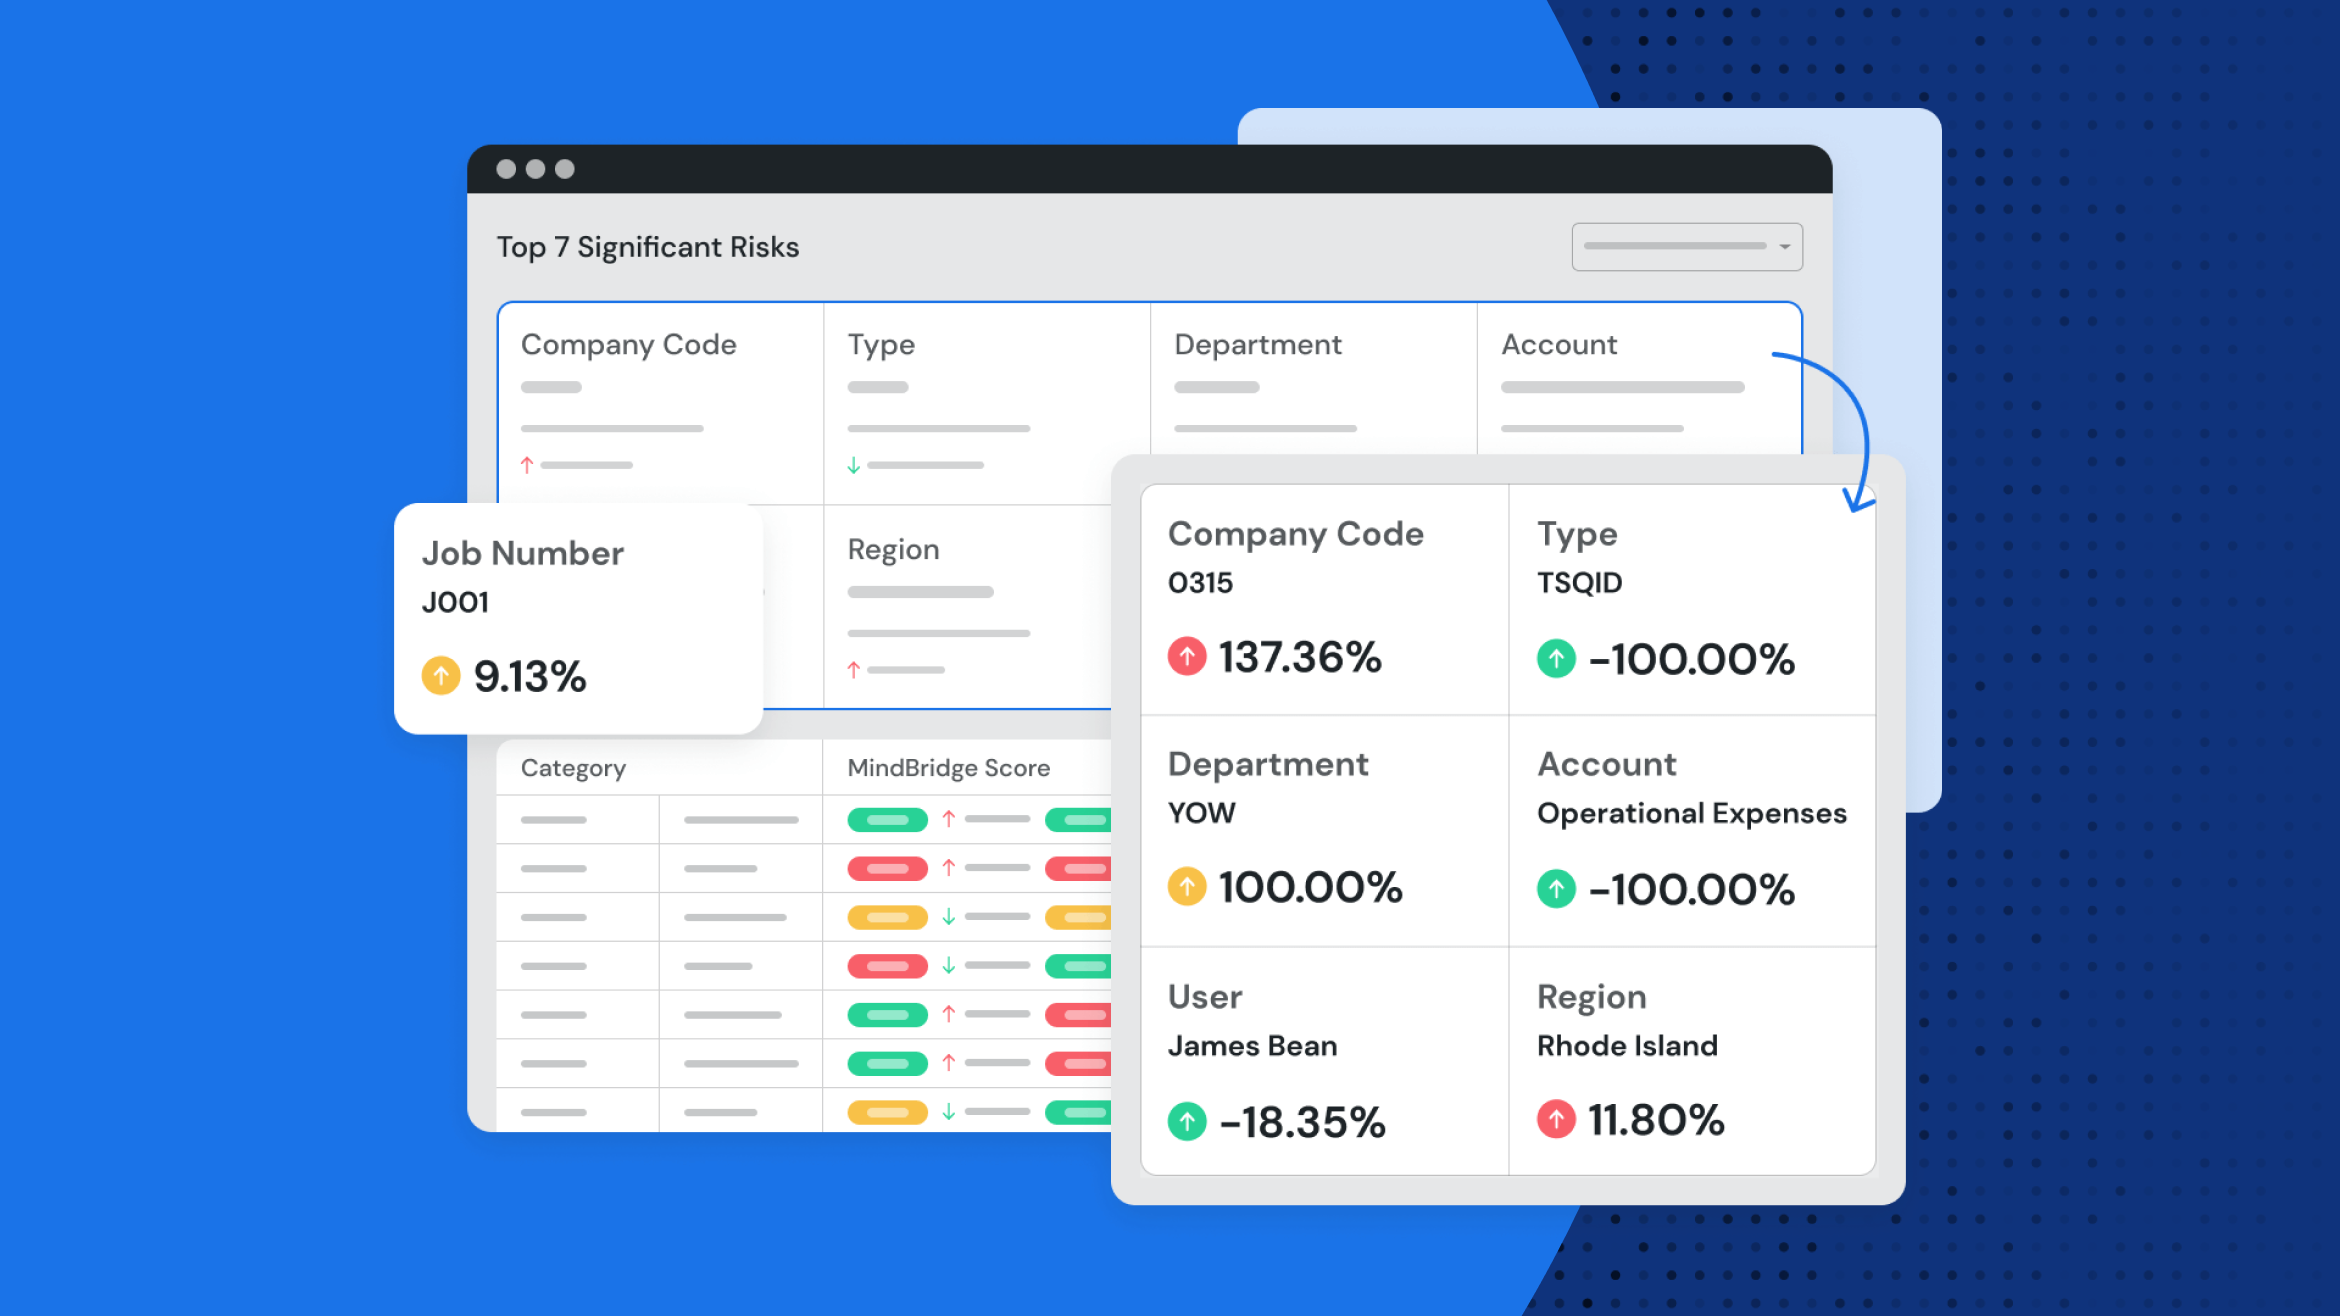
Risk segmentation
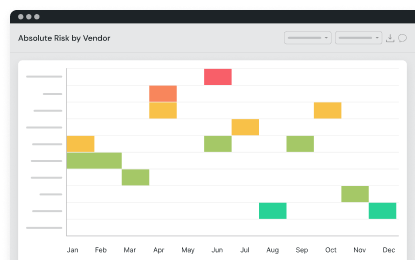
Targeted risk discovery, offering a dynamic and comprehensive view of risks within transactions across various operational aspects and risk drivers.

Prior period comparisons
Changes over periods are flagged based on analyzing transactional structures, risk levels, volume, and monetary value.
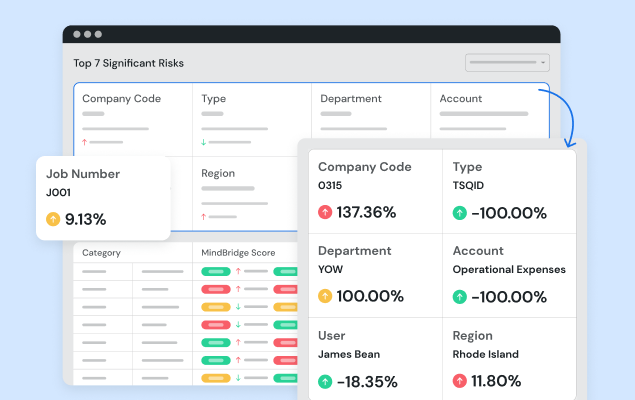
Configureable analysis
Configurable libraries based on industries enable the building of business rules and addition of fields to support customizable analysis.

Documented results
Auto-generated reports based on dashboards and data exploration provide streamlined documentation for reporting.

Trend analysis
Trending visualizations enable period-over-period analysis based on activity, with the capability to dynamically filter using various fields.
Browse all products
AI-Powered Payroll Risk Discovery with MindBridge Analytics
